Creative and daring ways
Surface seismic data inversion for gas hydrates
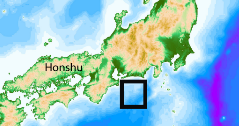
This high resolution seismic dataset (surface 2D-line) was acquired offshore, south of Honshu (Japan), see figure below.
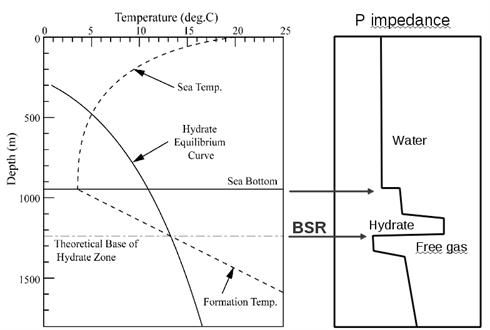
The goal was to detect and image the top and the BSR of the gas hydrates. The hydrate equilibrium curve and the corresponding impedance contrasts are explained in figure below.
The migrated images allow to detect the BSR due to the negative reflection coefficient (reverse polarity) but the details of the image are not clear (see below).

We can see the water bottom below 600m depth, the top of the gas hydrate and the BSR. The multiparameters FWI results provide much more accurate images. These results have been presented at the annual meeting of SEG in 2007.
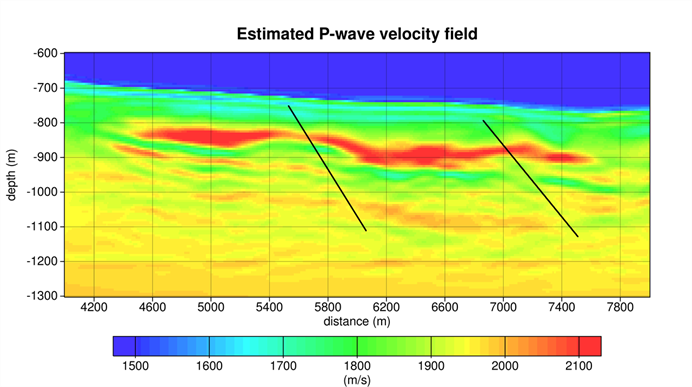
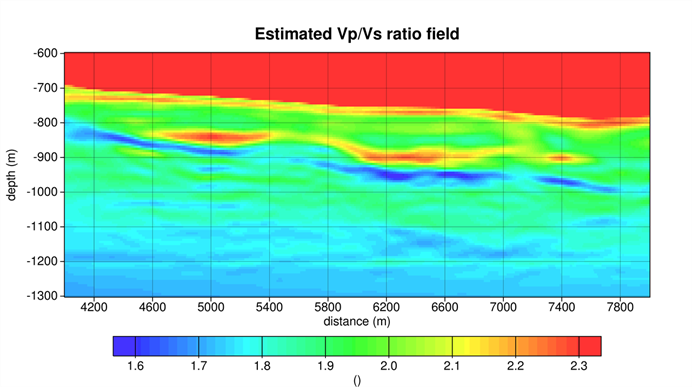
The P-wave velocity estimated field (top) provides the accurate shape of the gas hydrate (in red) and point out 2 small faults indicated by thin black lines. The Vp/Vs ratio estimated field (bottom) provides a complementary information, the high values characterize the solid gas hydrate (very rapid for P-wave) while low values of the ratio are typical for free gas in porous sediments. The spatial resolution is good, delineation is good as well and the obtained values are those expected. These two small faults induce the leaking of gas which is clear of the image as the BSR if going up and this is not clear on migrated image. The multiparameters FWI provides discriminative additional information.